Pinterest is a great platform for sharing and discovering images, ideas and content. It’s also relevant for B2C marketers that want to increase engagement with their brand. With Pinterest analytics tools, you can see who’s most interested in your content and how they’re interacting with it.
In this guide, we’ll explain how to interpret Pinterest analytics, best practices for increasing your reach among Pinterest users and the key terms you need to know.
Pinterest analytics requirements
To start off, you need to make sure your Pinterest account is a business account. It’s a fast and easy process. With a business account, you can access Pinterest analytics and set up ad campaigns.
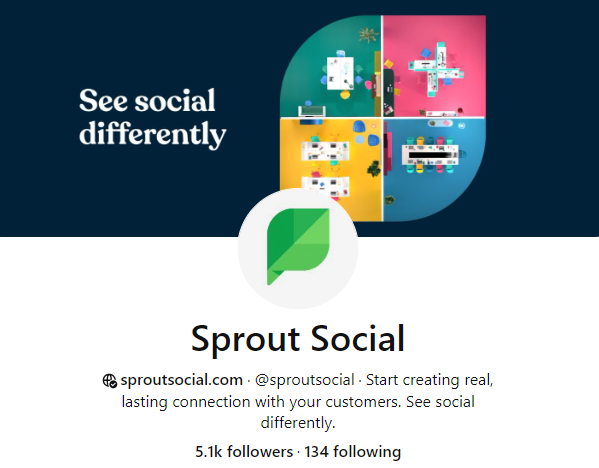
Next, claim your website. Once you do that, your Pinterest profile will display a small globe icon next to your URL, verifying your identity. You’ll also be able to see analytics for Pins that users create from your website, and those Pins will include your profile photo and a “follow” button.
You can claim your website in one of three ways:
- Add an HTML tag to your website.
- Download Pinterest’s HTML file and upload it to your site.
- Add a TXT record to your domain name system (DNS).
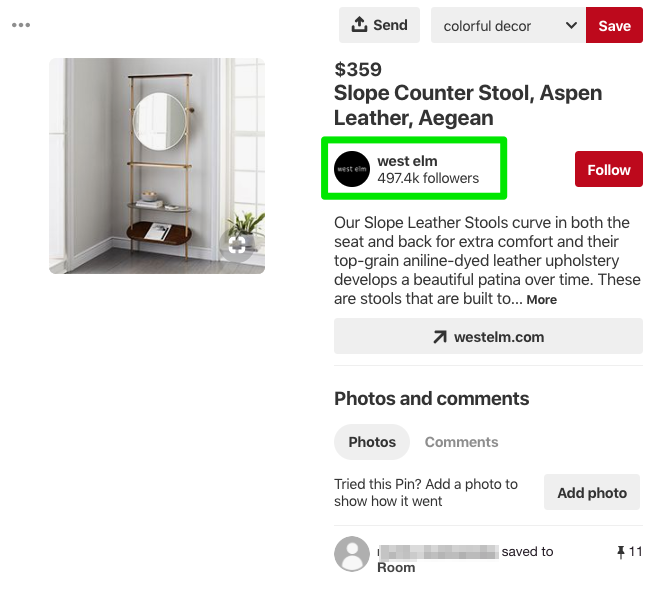
When Pinterest users save a Pin from your claimed website, your profile photo appears as subtle branding.
Creating a business account and claiming your website are the two essential steps for gaining access to your analytics and key metrics. You can also:
- Install a save button so users can easily Pin from your website. It’ll also generate analytics on which Pins send you referral traffic from Pinterest.
- Add a Pinterest tag to measure actions someone takes after seeing your promoted Pins (paid ads).
- Add Rich Pins for your products, articles and apps. These provide a little more information in the Pin when a user Pins from your site.
Pinterest analytics terminology
Pinterest analytics terminology is similar to that of other networks. If you’re already working with Facebook and Twitter reports, these Pinterest terms should feel familiar.
Profile overview
In native Pinterest analytics, you’ll see statistics like impressions and viewers. Pinterest Impressions are the number of times one of your Pins shows up in a feed, search results or category results. Viewers are the number of people who have seen at least one of your Pins.
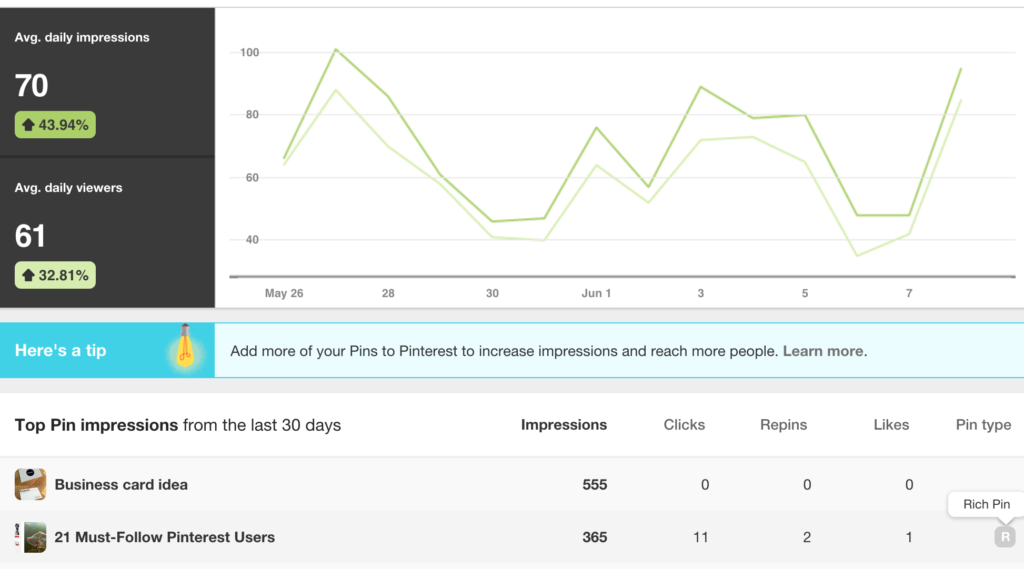
Looking at both the viewers and impressions helps you understand how engaged your audience is. If your Pins have a lot of views but few impressions, that could mean you need to improve your SEO to ensure your Pins show up in search results.
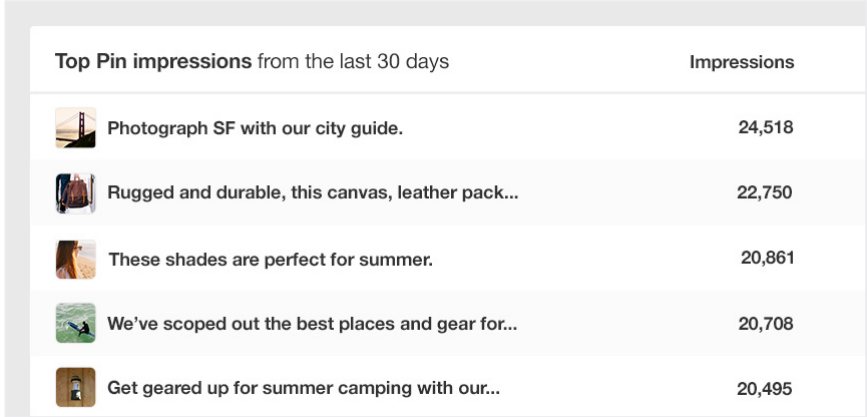
Another helpful feature of Pinterest’s native analytics is the Boards with top Pin impressions. This table gives you information on which boards are performing well, which will help you understand what to focus on. If you’re constantly posting on one board but finding that the Pins are not resonating, then it might be time to cut your losses on the board or adjust your Pinterest strategy.
Audience growth
Pinterest uses “followers” as Twitter does. A new follower is someone who follows your account, not just one of your boards. Pinterest will notify you anytime someone follows you or your boards.
In Sprout Social, your Smart Inbox will tell you when you have new comments and posts, and the Sprout Pinterest Profiles Report will show your audience growth for the reporting period you define.
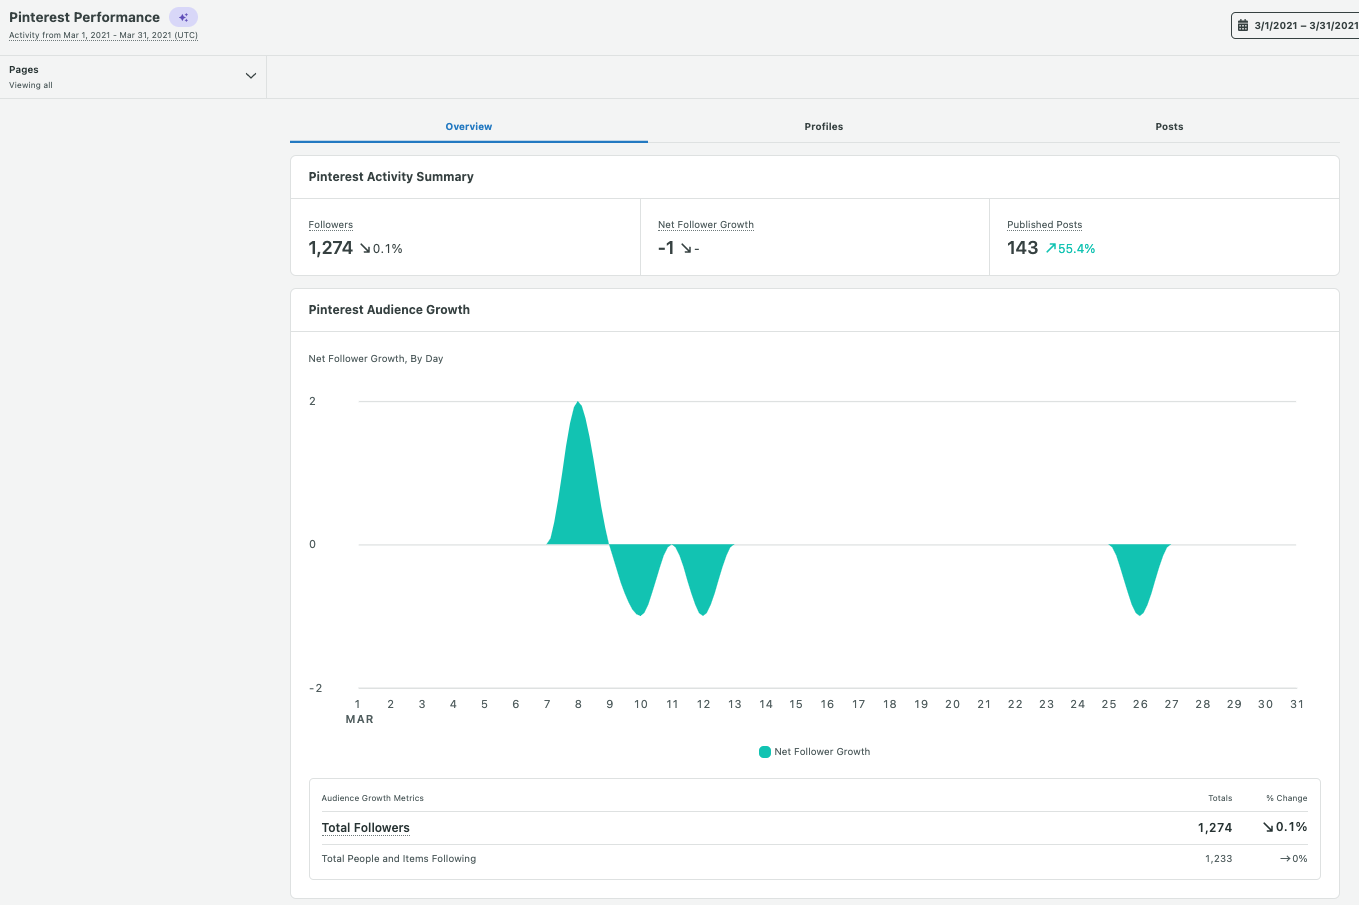
The Pinterest Profiles Report includes data on followers and overall pin performance. When you’re looking at your audience growth, these metrics can reveal how well your content is performing. Are your Pins engaging enough to earn a follow? Is your brand keeping track of top-performing content?
Publishing
The Sprout Pinterest Profiles report provides an overview of how consistently you Pin on the network, your Pins Sent and your Average Pins Per Day. If you see gaps in your publishing or notice that you Pin more often on some days you may need to reevaluate your strategy.
Pinterest strategy is a long game for brands, and you’ll need to post consistently for the best results.
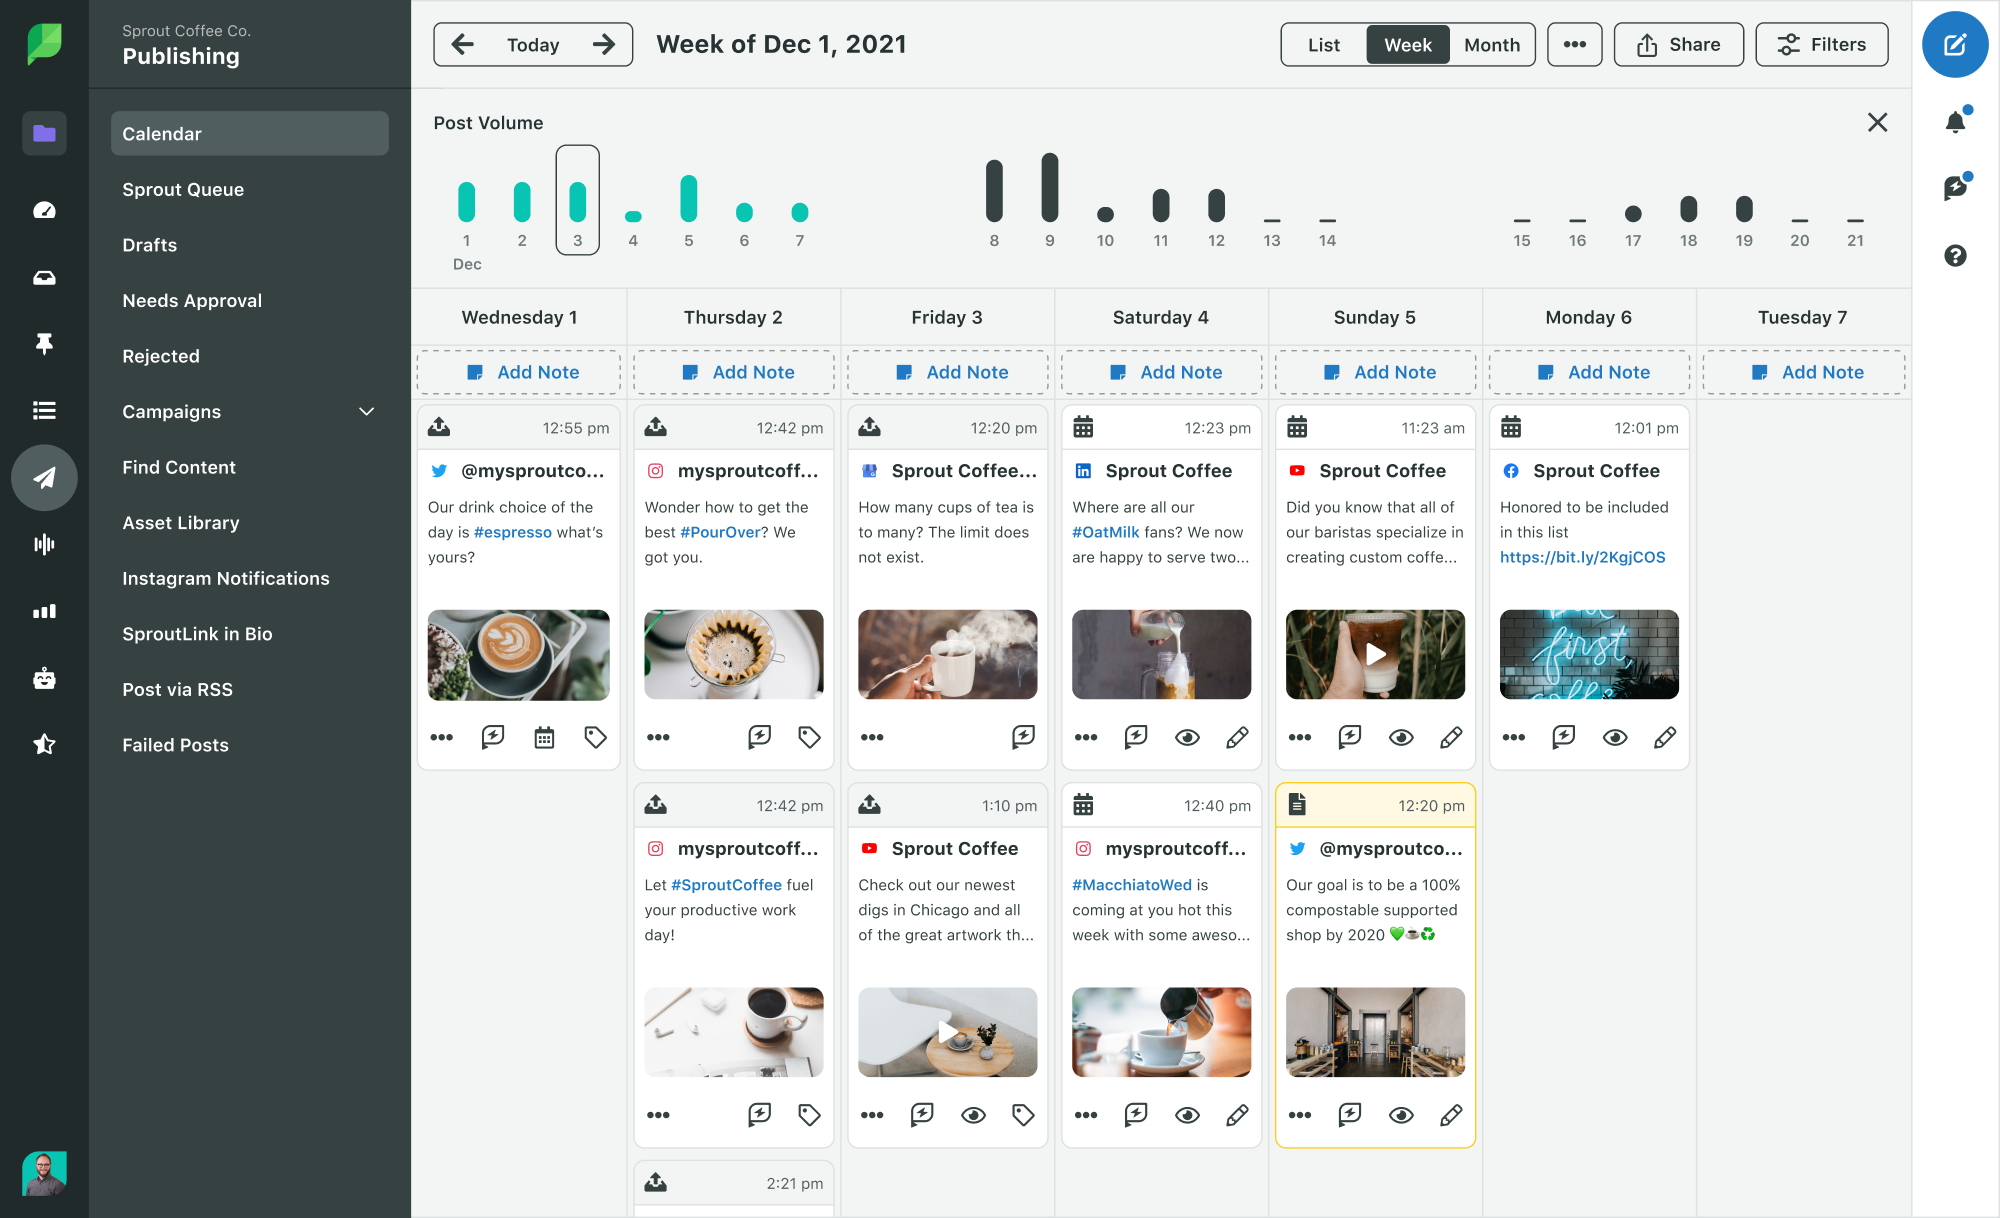
To do this, use a feature like Sprout’s Publishing Calendar to schedule your posts. Collect or create your Pins, then schedule them out so you don’t have to worry about timing. Your scheduled Pins will show up next to all of your other network posts, giving you a great overview of your content calendar.
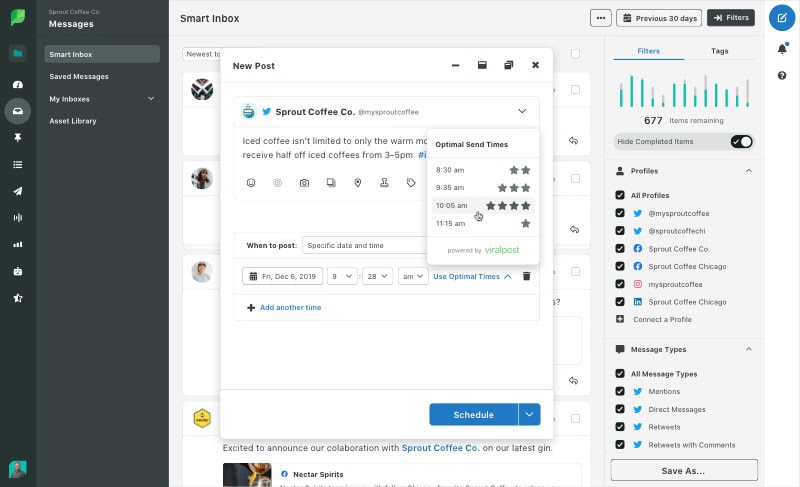
Sprout’s scheduling feature lets you either select post times or automate post timing with ViralPost. If you choose ViralPost, the software will schedule the posts at times that historically have the highest engagement. This proprietary feature learns as you post, so the more you post, the more it understands when your audience is around.
Individual Pin analytics
Pinterest provides several metrics that help you analyze the performance of your individual Pins.
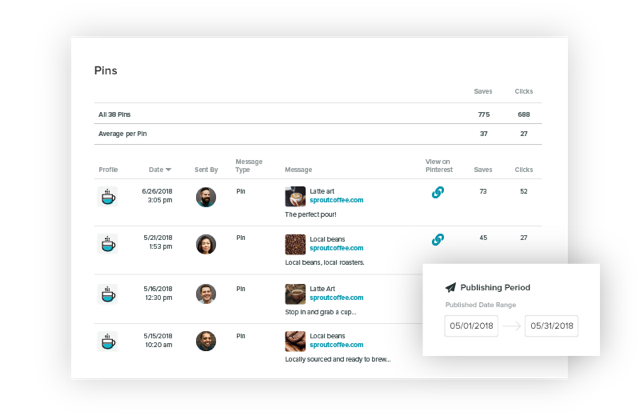
The individual Pins (Message Type) are categorized as either Pins or Saves.
In your account, they all display as Pins, but how they got there is what differentiates them:
- Pins are original — you scheduled them, uploaded them natively or created them from a website.
- Saves are someone else’s Pin that you saved to your own board.
For each Pin or save, you can see the number of user comments, saves and clicks. A click is when a user opens your Pin and/or clicks through to the linked website from the Pin. Your top Pins are those with a high number of saves or clicks.
Website Pins
Once you’ve claimed your website, you can see what content users are saving to Pinterest.
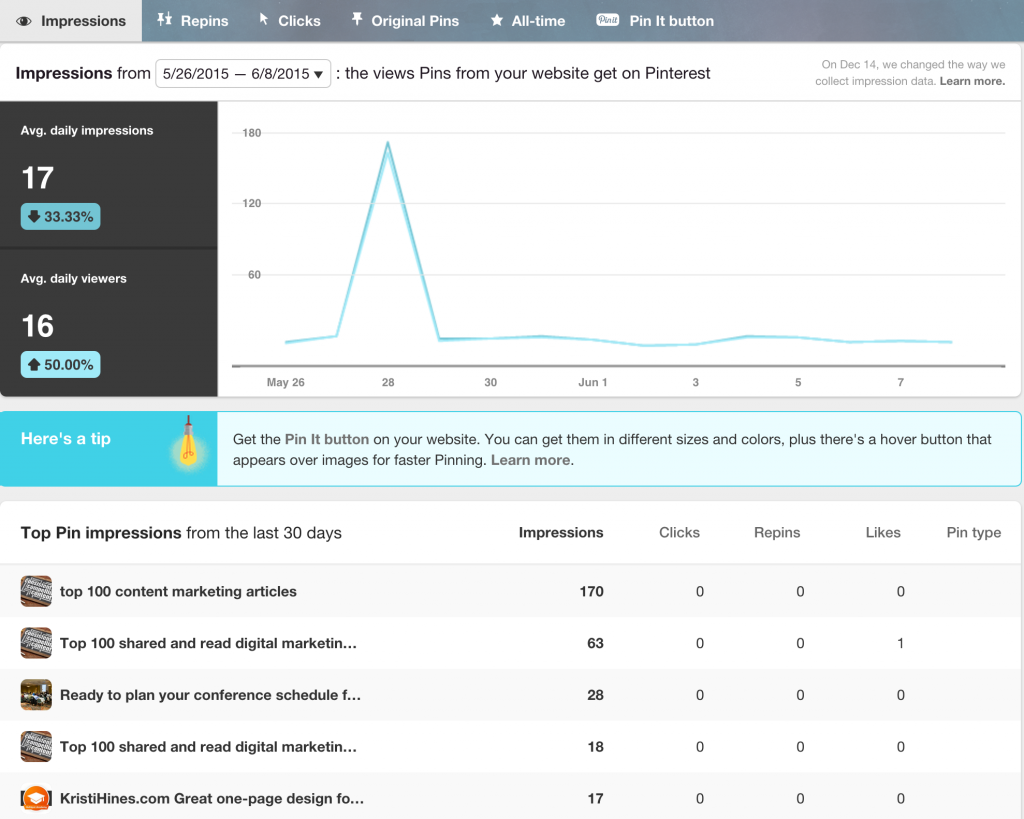
In the Website section of your native analytics, you’ll find some helpful charts that rank top Pins originating from your website by impressions, saves and clicks.
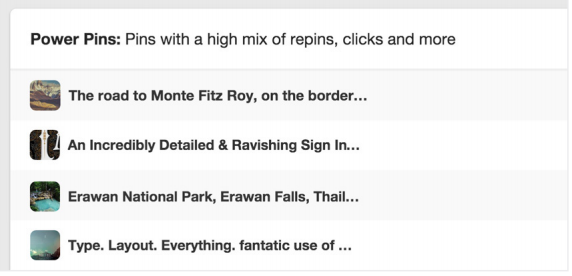
Identifying your most popular Pins can help you determine how to fine-tune your Pinterest strategy. In your Pinterest dashboard, click on the All-time category to see your Power Pins—or Pins that have a high number of saves, clicks and repins.
Audience insights
The key to understanding what resonates with your audience is knowing already who you’re marketing to. It’s not enough to know who the average user on Pinterest is, though it’s helpful if you’re just starting out on the platform.
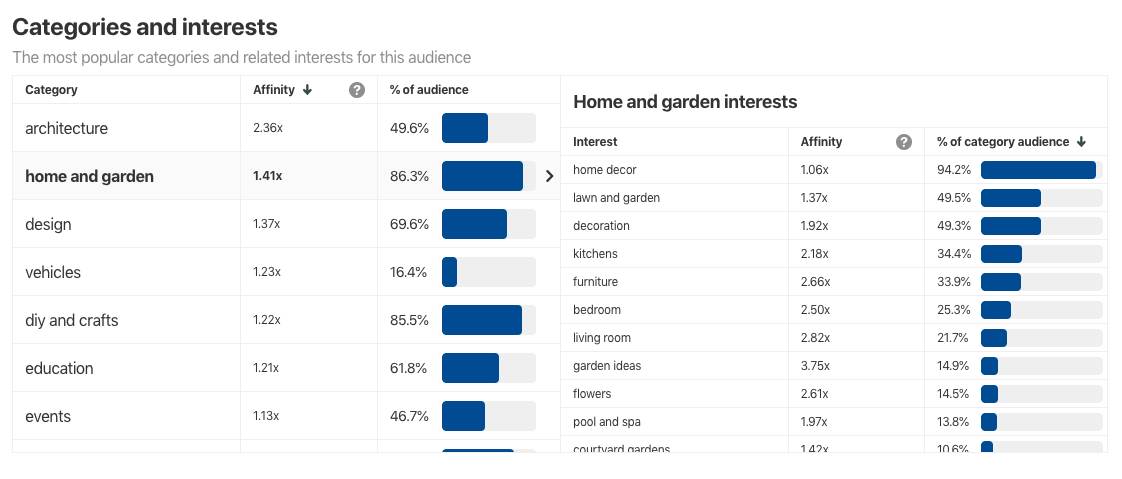
The Audience Insights page on Pinterest gives you a glimpse into your own audience and Pinterest’s overall audience. There’s also a helpful comparison tool to assist you in benchmarking your audience. You can look at categories and interests to see relevant keywords. For example, the “food and drink” category also shows how many are interested in snack mix recipes and sweets.
Additional audience demographic information includes age, gender, location (by metro area and country) and device. Use this information to your advantage by creating Pins for the categories that appeal to your audience. The sub-interest breakdowns also help you find keywords to use in your Pins and in your advertising strategy.
Every audience category has an affinity score, which indicates how interested your audience is in the topic compared to the rest of Pinterest. A high-affinity score means that your Pins on that topic are resonating with that audience.
Ramp up your marketing with Pinterest analytics
With roughly 430 million monthly average users, Pinterest could become an important part of your social media campaigns—as long as you understand Pinterest analytics.
Pinterest analytics will give you insight into what type of content is working well, so you can create more of it. The website analytics also give you information on what parts of your site’s content viewers are finding most useful. The lessons you learn from Pinterest may also help you optimize your strategies on other social platforms.
Stay ahead of the competition. See Sprout Social’s report on social media trends, and start scheduling your posts with Sprout today.
The post Pinterest analytics: a guide for marketers appeared first on Sprout Social.
from Sprout Social https://ift.tt/JRaOP2q
via IFTTT
No comments:
Post a Comment