Tuesday, 6 October 2026

Holiday shopping is happening earlier than ever, here’s what brands need to know

Halloween candy is still on the shelves, but holiday shoppers are making wish lists and hunting for deals months before the holidays arrive.

But as the shopping season gets longer, budgets are getting tighter. For brands, that means more chances to get in front of consumers, but also more competition for every dollar shoppers spend.

Data from Sprout Social’s Q3 2026 Pulse Survey points to three factors that will define the holiday season: campaign timing, price sensitivity and meeting shoppers where they’re increasingly discovering gifts—on social.

Consumers don’t want earlier holiday campaigns, except when they do

Consumers have mixed feelings about how early holiday marketing should start.

According to Sprout’s Q3 2026 pulse survey, nearly half (49%) say campaigns launched as early as August make them more likely to buy, including 19% who say they’re much more likely. Just 11% say an early start makes them less likely to purchase.

But ask consumers when brands should launch their holiday campaigns and the story changes. Half point to October or November as the ideal window, compared to 21% who prefer August or September. Another 12% say brands should wait until December.

Those findings may seem contradictory, but they point to a distinction between when consumers want holiday marketing to dominate their feeds and when they’re open to discovering seasonal products. Shoppers can be receptive to gift ideas, new products and seasonal inspiration well before they want brands to go all-in on holiday messaging. In other words, an earlier presence can influence what they eventually buy without making it feel like the holiday season starts in late summer.

The sweet spot: Show up early without going all-in. Use August and September to build awareness and consideration, then ramp up your holiday campaign in October and November.

For example:

  • Tease what’s coming: Preview holiday collections, seasonal launches or upcoming offers.
  • Get gift-worthy products on shoppers’ radar: Introduce products consumers might want to add to their lists before they’re ready to buy.
  • Start publishing seasonal content: Share gift inspiration and other useful holiday content that gives shoppers a reason to engage early.

Starting earlier gives you more room to test what resonates before peak shopping begins. Then you can put more support behind the products, messages and offers gaining traction.

Brands are already putting this approach into practice. Fenty Beauty, for example, launched its limited-edition holiday collection in September, giving shoppers an early look at its seasonal products. As of writing, the TikTok has received over 100K views and over 5K likes.

TikTok post from Fenty Beauty promoting its limited-edition 2026 holiday collection in September.

Timing also depends on who you’re trying to reach. Younger consumers are especially receptive to an early start: 66% of Gen Z consumers say campaigns launching as early as August make them more likely to buy, compared to 49% of consumers overall.

Tariffs and price pressure are reshaping purchase patterns

Many consumers see shopping earlier as a way to get ahead of rising prices. More than a third (36%) say they’re starting their holiday shopping earlier specifically to avoid tariff-related price increases. Another 27% aren’t shopping earlier yet but are concerned about prices.

In total, 63% of holiday shoppers are thinking about the impact of higher prices.

Those concerns are also affecting how much consumers plan to spend. More than half (56%) expect to reduce their holiday spending this year because of economic conditions like tariffs and the cost of living. Only 30% say they don’t plan to cut back.

Price sensitivity doesn’t mean every brand needs to compete on having the lowest price. Shoppers may be looking more closely at what they get for their money, so holiday content should make value clear. Highlight product quality, versatility or other details that make a purchase feel worthwhile.

Discounts can also tip the scales: Promo codes shared by brands or influencers are the top purchase driver, cited by 30% of consumers. Lastly, brands with products at multiple price points can also organize gift recommendations by budget, making it easier for shoppers to find options that work for them.

For example, last holiday season, REI shared a roundup of expert picks under $50 on Instagram, with a CTA to check out their larger holiday gift guide.

Instagram post from REI featuring expert holiday gift recommendations under $50.

Consumers are discovering gifts on social this year

Social media now rivals in-store shopping for holiday gift discovery. This year, 46% of consumers say they’ll turn to social for gift ideas and product discovery—the same percentage who plan to browse physical stores.

Where consumers turn for holiday gift ideas:

  • Social media: 46%
  • Physical stores: 46%
  • Recommendations from friends and family: 34%
  • TV: 31%
  • Review sites: 23%
  • AI chatbots: 15%

And social’s influence is still growing. Compared to the 2025 holiday season, 28% of consumers plan to use social more to find gifts this year, while another 50% expect their usage to stay about the same.

That creates an opportunity to reach shoppers before they know exactly what they want to buy.

Think about how easily someone encountering your brand for the first time can understand what you sell, who your products are for and why they’re worth considering. Content organized around recipients, interests, occasions or price points can make that discovery process easier and give shoppers a reason to explore your products further.

Bookshop.org, for example, used Instagram to promote its 2025 holiday gift guide, which curated hundreds of recommendations for different types of readers and paired them with a limited-time discount.

Instagram post from Bookshop.org promoting its 2025 holiday gift guide and a 15% discount code.

What drives a purchase on social?

Discovery is only the first step. Once shoppers find a product on social, the content surrounding it can influence whether they buy.

According to the Q3 2026 pulse survey, promo codes shared by brands or influencers are the top social-specific purchase trigger at 30%, followed closely by brand posts showing products in action at 28%. Original holiday content from brands influences 26% of consumers, while 22% point to content from non-influencer users.

Taken together, these findings show that shoppers respond to a mix of incentives, brand content and recommendations from other people. Holiday content plans should reflect that variety. A steady stream of promotional posts may capture shoppers looking for deals, but product education, original seasonal content and posts from customers or creators can give others the context they need before buying.

Creator partnerships in particular can give shoppers more context as they weigh their options. In this paid TikTok partnership, creator KC walks viewers through luxury holiday gift sets, giving them a closer look at several products in one video.
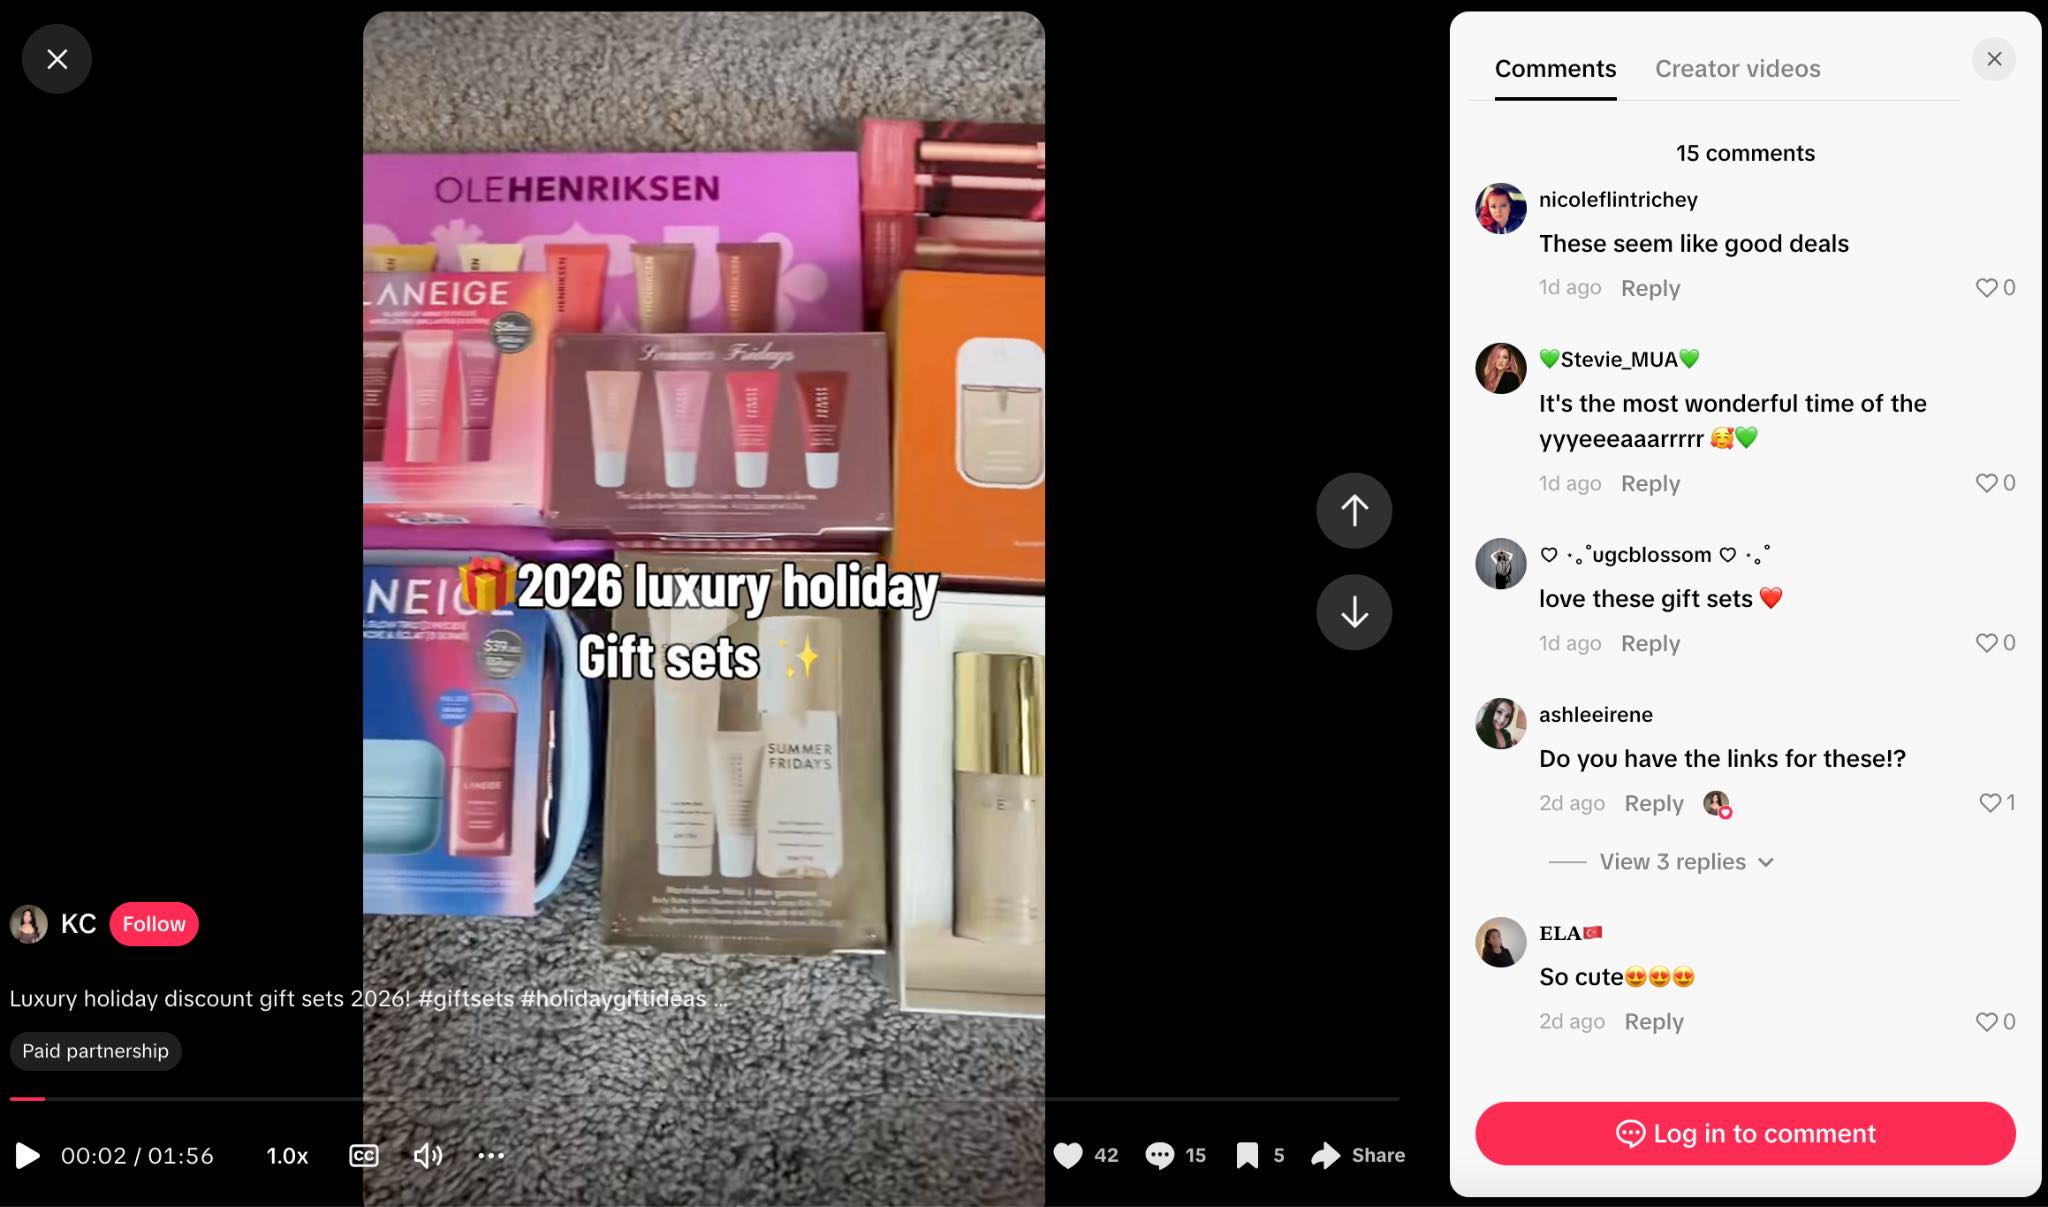
TikTok creator KC shares a roundup of luxury holiday gift sets in a paid partnership.

Build that variety into your holiday content strategy:

  • Make products tangible. Show how they look, work or fit into someone’s life so shoppers have more context before purchasing. This also extends the campaign’s shelf life beyond the holiday season.
  • Give shoppers an incentive to act. Make promo codes easy to find, use and share across brand and influencer content.
  • Create for the season. Give holiday creative its own identity rather than relying on generic “shop now” messaging. Also consider using a holiday hashtag calendar to plan around relevant moments throughout the season.

Social commerce and social customer care will play a bigger role this holiday season

Finding the perfect gift can lead to an immediate purchase—or a question about shipping, sizing or availability. This holiday season, consumers increasingly expect brands to handle both directly on social.

Make the path from discovery to purchase seamless

More than half (57%) of consumers are open to completing a purchase directly within a social app this holiday season. That includes 38% who have purchased this way before and plan to do so again, plus 19% who are ready to try it for the first time.

As more purchases happen directly on social, brands need to remove as much friction as possible. Review your social commerce strategy before holiday traffic picks up, keep product information current and make key details like availability, shipping timelines and return policies easy to find.

Prepare your social inbox for more customer questions

More than a quarter (27%) of consumers expect to use social more for holiday customer service than they did in 2025, while another 59% expect their usage to stay about the same.

Commerce and customer care increasingly overlap on social. A question about sizing, inventory or delivery might be the last thing standing between a shopper and a purchase. Plan for holiday-level service volume throughout Q4, not just during Black Friday and Cyber Monday.

Clear workflows, adequate coverage and quick access to order and product information can help social teams keep up as purchase and service activity increases.

What this means for your 2026 holiday strategy

Holiday shopping habits are changing, but the data gives marketers a clearer picture of how to adapt. As you finalize your 2026 holiday strategy, focus on three priorities:

  • Give yourself a longer runway. If your holiday campaign is already underway, use October and November to ramp up promotional activity. Then take what you learn this season into 2027, when you can start building awareness as early as Q3.
  • Compete on value, not just urgency. Price-conscious shoppers will be paying close attention to what they’re getting for their money, so make pricing, promotions and value clear.
  • Plan beyond social awareness. Consumers are finding gifts, making purchases and seeking customer service on social. Your holiday strategy should account for the entire journey.

Use these findings to benchmark your current holiday content plan and identify where you may need to adjust your timing, messaging or channel strategy. Then explore our holiday marketing strategies for more ideas to turn those priorities into campaigns that connect with shoppers this season.

The post Holiday shopping is happening earlier than ever, here’s what brands need to know appeared first on Sprout Social.


from Sprout Social https://ift.tt/Ll7Xk6i
via IFTTT

Data storytelling: Turning social insights into a narrative your org acts on

Engagement is up. Your brand is seeing a spike in mentions. Sentiment is trending positive. People are sharing a hack about one of your new products. They’re all positive signs, but if you can’t translate what they mean to the business, those numbers stay trapped and nothing changes off the back of that good momentum.

That’s where social teams find themselves stuck. The data they have access to is often the freshest, most unfiltered view of what the market is actually saying, filled with unprompted takes and reactions from the world’s largest focus group. But according to the 2026 Social Intelligence Report, only 36% of organizations are able to use those insights to regularly inform decisions outside of marketing.

That’s when a data problem becomes a storytelling problem. Building a narrative around the data and helping people understand why it matters, and what it means to them, is crucial to help insights from social have an actual business impact.

So what makes a story land? How do you visualize data and shape it into something that drives a recommendation? Below, we’ll cover what data storytelling means for social teams specifically, the building blocks of how to make those stories resonate and a step-by-step framework for putting one together, as well as what to avoid.

What is data storytelling?

Data storytelling is the practice of merging data science, narrative and visualization to give life to the insights in a dashboard, honing in on what they mean and why decision-makers should care. In short, it’s translating the numbers in a spreadsheet into a compelling story, which ultimately leads to a decision being made.

Social is a prime source for this kind of data storytelling, as it offers market intelligence for the business. Every other data source (including CRM records, support tickets, pipeline reports, etc.) reflects what customers do once they’re already actively engaged with you in some way. Social captures live reactions from a much wider audience, with unprompted takes that show up there before anywhere else. A spike in comments questioning a pricing decision or a wave of praise for a feature being deprecated is a story that should be told across the business, not sitting in a dashboard.

Social listening and other tactics can help you find those signals, but shaping them into a story that makes the rest of the business sit up and take notice is where data storytelling comes in.

Why data storytelling matters more than ever

Being able to translate insights into something people can take into their decision making is a key skill for teams that work cross functionally, like the social team. Though the same data is the basis for every narrative, each team wants it packaged differently, as a story that’s relevant to them, and being able to act as that translation layer increases any team’s influence.

For example, executives naturally lean on quantitative data because there’s an easy map to the bottom line. So show them how audience growth or engagement correlates with pipeline, or how improved response time correlates with retention. That’s the basis of the story they want to hear. But qualitative data also matters, whether that’s comments, screenshots or customer feedback. This adds color to the story and helps build it into a narrative that backs up the numbers.

This is important because 86% of organizations say they’ve missed real business opportunities in the past two years because insights from social were delayed, siloed or underused. Some of that might be a data problem, but much of it is a governance problem. The insight exists but isn’t getting to other teams, or it was never shaped into a narrative a decision-maker could act on before it was too late.

That’s why data storytelling is so important. It’s more than a visualization of data, it’s the narrative that helps define how to improve the business.

The building blocks of a strong data story

Like any good story, a data story needs to be built with the audience in mind. That starts with knowing who’s going to be receiving it, then selecting the right data to highlight and translating it into language they already use.

  • Executives and leadership want to understand business impact. Translate social metrics into revenue, retention or risk, with charts they can understand at a glance.
  • Product and R&D want signals distilled from qualitative feedback. Show them examples of what customers are asking for or struggling with, highlighting the voice of the customer.
  • Customer care wants to see impact. Frame the story around volume, response time and improvements to process.

Once you know the audience, you can go about building the narrative.

Ground your insights in contextual data

Numbers without context leave more questions than answers. Contextualize the change within your wider industry and competitors. Pair quantitative data that shows what happened with qualitative data that shows why it happened. Don’t just report a number, show why the number changed and what it means for the business.

A slide showing how to use qualitative data to support quantitative in a data story

Visualize with intent

Every visual should make your story easier to grasp, not just fill space. Keep a few rules in mind:

  • Choose colors that support your message and avoid distracting from it.
  • Design for readability first; a chart should communicate at a glance.
  • Avoid complexity. If a visual needs a long explanation, simplify it or split it in two.
  • Match the format to how it’s being received. A dense report table works fine in a document; it will rarely land in a live presentation.

Give it a narrative arc

The most memorable data stories follow a familiar shape: set the scene, introduce the obstacle, hit the climax and land on a resolution. Applied to a social report, that might look like: here’s where we started, here’s what changed and why, here’s the turning point in the data, and here’s what it means going forward. That structure is what makes people remember the story after they leave the room—and repeat it accurately when they explain it to someone else.

Get our template for creating a compelling data story

A step-by-step framework for building a data story

To make sure your data story demonstrates value, follow these steps before sharing your insights.

1. Identify the most interesting points

Put on your author cap and ideate the structure of your data story.

Have a main objective in mind, whether it’s relaying campaign status or justifying a bigger budget. What pieces of quantitative and qualitative data best support the main idea you want to convey? What data points directly contradict what you thought was going to happen?

2. Lead with your second most interesting piece of data

Don’t show your whole hand, but do command attention right at the beginning. For instance, you might say something like, “As you already know, sales are up this quarter. What you may not have seen is that this trend correlates with our increase in traffic from social.” Include any other interesting points after this, but don’t share your best one just yet.

3. Use visual aids as you share

Let those visuals we discussed earlier shine. An example: “As you may already know, sales are up this quarter,” (graph of this quarter’s sales appears). “What you may not have seen is that this trend correlates with our increase in social media traffic,” (the second graph of traffic by social networks appears as an overlay to the first graph). The visuals here add context to your data storytelling.

4. Predict questions or challenges

Naturally, your audience will analyze what they are seeing. In the example we’ve used so far, they may ask something like, “How do we know sales are up because social traffic is up, and not the other way around?” Incorporate slides or bullet points that answer the questions you expect your audience to ask. Questions are a good thing: They keep your audience engaged as you get ready to deliver your grand finale of data insight.

5. Save your best point for last

Leave your audience with takeaways they’ll remember by sharing your most interesting piece of data last. For instance, you could say, “We considered that correlation might not indicate causation, so we dug a little deeper and looked at the shares, social referrals and conversions. We were able to trace 33% of our new customers this quarter to one particular influencer’s post,” (screenshot of post here) “in which she raved about how our product helped her. She has over 700,000 followers, many of whom also shared the post and clicked through to our site from it.”

Notice how this example answers the question from the audience while providing quantitative and qualitative data. This sweet spot is what will make your data storytelling memorable and impactful.

6. Close with the “so what”

Data storytelling in marketing should always aim to answer the question “so what?” Round out your presentation with why this story matters to your overall social media and business goals. Then share how you’ll use this data to inform new ideas moving forward. For example, because this one influencer post did so well, you’re looking to partner with other influencers who have similar audiences.

This flexible format can be repeated as needed and applied to just about any medium, from presentations to reports and emails.

You may have lots of data to comb through to find the right points to cover. That’s why the first step is picking out the most interesting ones. It’s up to you to gather the data that best illustrates your main plot point and use it to focus your audience on the key message.

7. What to avoid when creating your data story

Social data in action is a beautiful thing, but there are a few things to avoid when developing your data story:

  • Ignoring your audience’s priorities
  • Overloading the story with too many metrics
  • Leaving out qualitative context
  • Using visuals that distract instead of clarify
  • Skipping visuals altogether
  • Leaning on text formatting instead of a real visual
  • Presenting a weak result with no context or path forward

Examples of effective storytelling with data

Get inspired with these data storytelling examples:

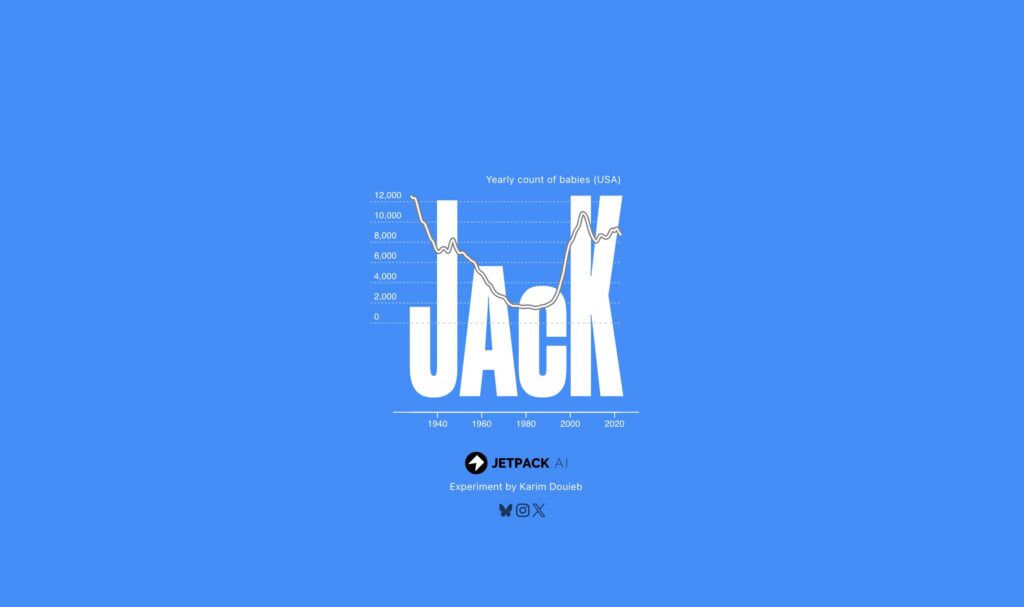
1. Jetpack AI

Jetpack AI shows that data storytelling doesn’t need to be complicated to be compelling. Their baby names visualization allows users to input any baby name and see how it has changed popularity in the US, shown as a line graph and changing letter sizes.

An illustrative example of Jetpack AI's Baby Names data visualization, showing the popularity of the name Jack rising and falling over time

There’s a gamification element to this, where users are invited to submit their own, encouraging learning and active participation from the recipient.

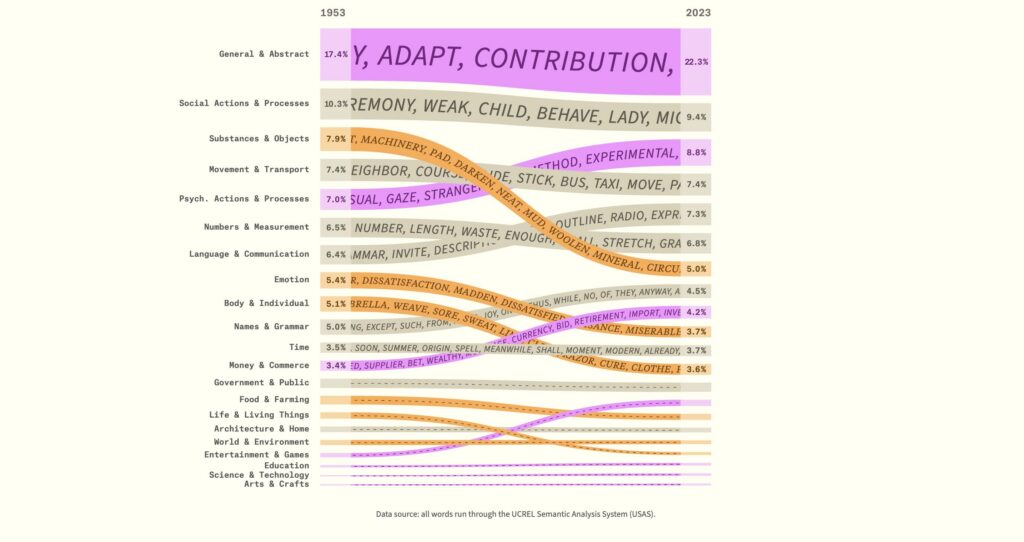
2. The Pudding

The Pudding is well known among fans of data journalism, consistently setting the standard for visual storytelling.

A graphic from the Pudding showing how vocabulary has changed in the last 60 years, visualized with data.

One of their recent pieces looks at the popularity of English words over time. Interactive elements keep the user hooked, and offer clear explanations that contextualize the data points they’re highlighting.

3. Sprout Social

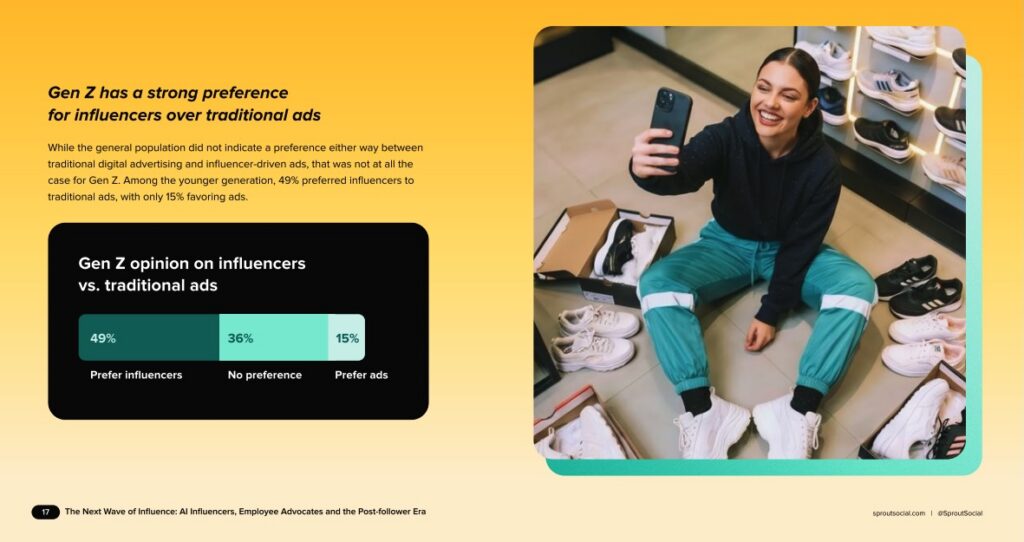
Sprout has some excellent data storytelling as well. Our data reports, like the 2026 Influencer Marketing Report, feature digestible narratives and visual aids.

An example from Sprout's influencer marketing report showing data visualization

Remember: Your visuals don’t have to be graphs and charts. You can use a graphic to emphasize a stand-out data point. The data gives context and suggests an action for the reader to take off the back of the data.

Craft a story that travels

A good data story earns attention in the room where you present it. A great one gets picked up and repeated in the rooms you’re not in, quoted back to you by an executive or referenced by product as the reason a feature made the roadmap.

Getting there takes more than just a chart. It takes knowing your audience, pairing your numbers with the context that makes them mean something and closing every story with a clear next step. Download our social intelligence metrics analysis template to start organizing your data into a story worth telling.

The post Data storytelling: Turning social insights into a narrative your org acts on appeared first on Sprout Social.


from Sprout Social https://ift.tt/Wum6Bqf
via IFTTT