For a successful social media marketing strategy, keeping tabs on the performance of your various initiatives is essential, especially on Instagram. This helps you know when to adjust a strategy or when a new idea is working.
But when it comes to digging into your Instagram metrics, it may not always be clear where to start.
This article will introduce you to Instagram insights, discuss why it’s so important to measure them and showcase the top eight Instagram metrics to watch.
What are Instagram metrics
Instagram metrics are measurements of performance that let you in on how your Instagram content is doing and how your audience is responding to it. Instagram metrics tell you things like how many people viewed or interacted with your content.
We’ll talk about specific metrics later on, but some of the key Instagram metrics you should be measuring include impressions, reach and follower growth.
Why you should track your Instagram metrics
If you manage your Instagram account without ever looking at your analytics, you’ll be left in the dark when it comes to understanding the results of your efforts.
These efforts likely coincide with company or department goals (or even just your own Instagram KPIs), which will naturally help inform which Instagram metrics you should be reporting on.
Therefore, when answering the “why,” you’ll also reveal your key IG metrics to report on. Here are three reasons why you should be tracking your Instagram metrics.
1. Instagram metrics let you know which content your audience prefers
If you’re testing different various types of content, you need to check out your post metrics to see which types are getting the most attention. Having this knowledge helps you to build out an Instagram content strategy that resonates with your audience by consistently posting their favorite types of content.
2. Instagram metrics keep your strategy in line with company objectives
If your current goals are to increase your company’s follower count, you’ll want to make sure you’re actually making that happen. Same goes for if you’re wanting to increase story views or post engagement. You need to be able to check the metrics to measure growth to see if you’re hitting your KPIs.
3. Instagram metrics help you measure specific campaign success
If you’re running a major campaign on Instagram (let’s say for a product launch, holiday sale or important partnership), you want to know how well the campaign is performing. Your Instagram metrics let you see this so you know if you need to adjust your messaging or not.
How to view insights on Instagram
In order to view insights and metrics on Instagram, you need to have an Instagram business or creator account. There are a couple of different ways to access your insights from the Instagram app. (Keep in mind that these are only accessible on the mobile app, and not on desktop.)
First, head to your profile and tap on the Professional dashboard button. The very first option is your account insights. Tap See all to access your Instagram metrics.
Second, you can tap the hamburger menu icon in the top right corner of your profile and then tap Insights to access them directly.
You can find all of the below metrics inside your Instagram Insights—or you can take advantage of a third-party analytics tool like Sprout Social to get even more in-depth reporting.
8 Instagram metrics you need to track performance
If you’re still feeling a little lost, don’t worry, we’ve outlined several key Instagram metrics to help you get a feel for what to look for and where to find it.
And as a bonus, we’ll even make sure you know exactly where to capture most of these Instagram metrics within Sprout Social.
1. Impressions
What this metric tells you: How many times your content is being seen.
Your impressions let you know how many individual times a piece of content has been viewed.
This is useful because a lot of impressions can mean that a certain piece of content was well-liked, and people wanted to come back to it. However, when it comes to Instagram ads, too many impressions can lead to ad fatigue and reduce conversions.
Quickly locate impressions in Sprout
To find your impressions in Sprout, head over to your Instagram Business Profiles Report. Within the Instagram Impressions section, you’ll see the total and percent change over the specified time frame.
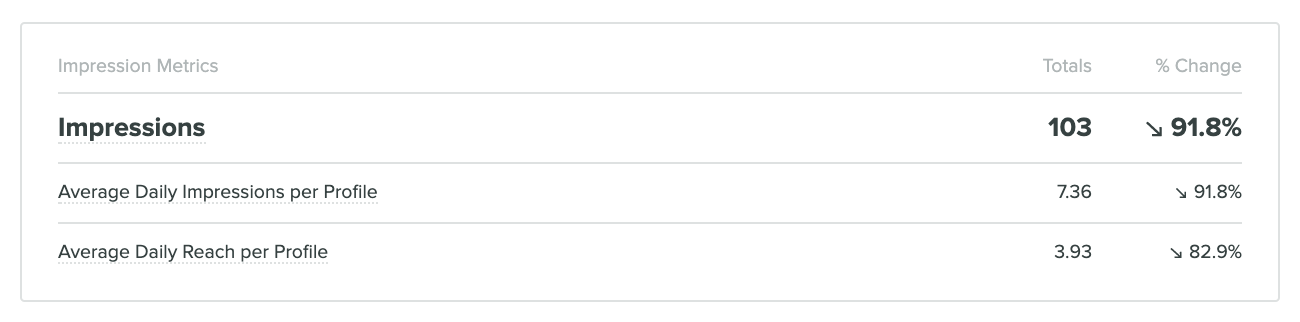
2. Reach
What this metric tells you: How many people are seeing your content.
If you think reach sounds a lot like impressions, you’re not alone.
These two metrics are similar but confusing enough that we’ve dug deeper into these topics in great detail via Reach vs Impressions and Instagram Impressions (if you’re inclined to learn more).
To keep it brief here, all you need to know is that your Instagram reach indicates actual views of your content while impressions means it was displayed but may not have generated a click or any other form of engagement.
Quickly locate reach in Sprout
Your reach is located in the exact same space as your impressions. You can see total and percent change right below your impressions metric, making it easy to see both at once.
3. Engagements per follower
What this metric tells you: Engagement with your content relative to your follower count.
While it may be tempting to compare your Instagram performance to that of the big guns (think Oreo, Starbucks, Nike, etc), you don’t want to do that unless your audience size is roughly the same.
Why?
Because brands with millions of followers should be racking up thousands of likes. However, if you have just a couple thousand followers, you’re naturally not as likely to accrue similar results in sum, but that doesn’t mean you’re not still performing exactly as you should be.
And that’s where engagement rate (or engagements per follower) comes in and can help make sure you’re evaluating your account fairly.
The formula for measuring engagement rate on Instagram looks something like this:
Total Engagements / Follower Count * 100 = Engagement Rate
Reporting on this metric over time will give you a sense of overall performance trends, though you can certainly calculate it for specific posts as well to get an idea of the types of content that resonates with your audience.
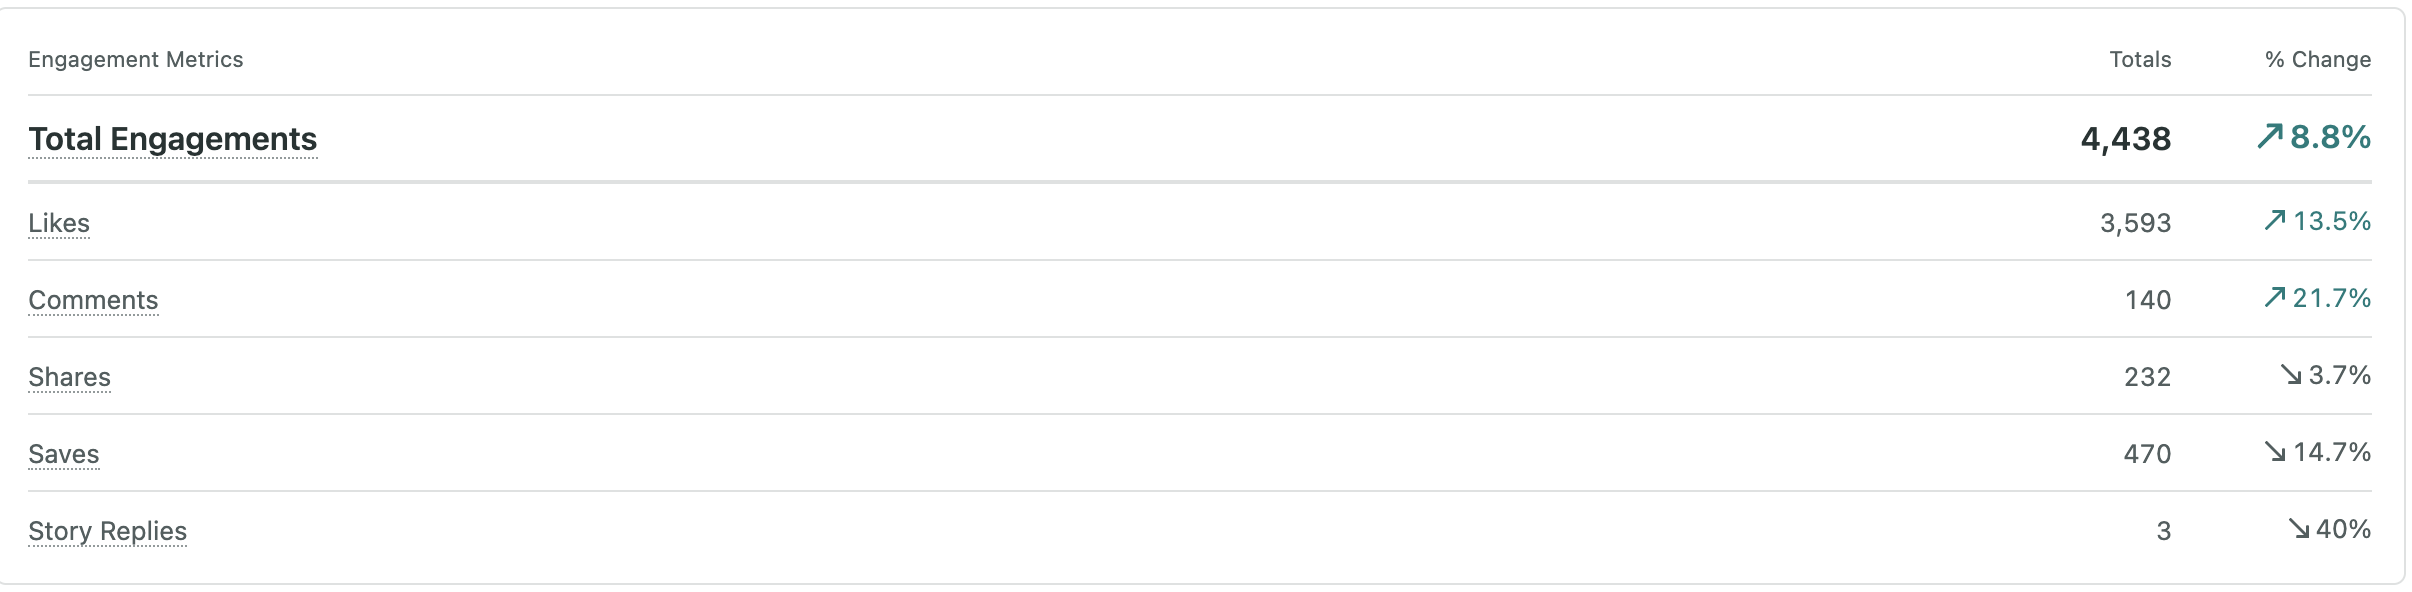
How to measure Instagram engagement rate with Sprout
In order to find this Instagram metric, you’ll want to first gather the total amount of engagement you received for a given time frame.
Within Sprout, navigate to the Reports tab and under Profiles by Network, click Instagram Business Profiles.
Near the bottom of the Overview tab, you may notice a section with engagement rate already calculated, but note that this rate uses impressions (not follower count).
4. Follower growth
What this metric tells you: Whether your follower count is steadily increasing or declining.
When evaluating a growing (or shrinking) Instagram follower count, context is important, especially if you’re experiencing random spikes or drop offs due to something like a one-time promotion or paid social ads.
Make sure to measure your follower count over time and keep the above context examples in mind so you know exactly what has contributed to the growing numbers. Ideally you’re seeing sustained, gradual growth over time, which indicates that people are liking what they see from your content and they want to make sure they see more of it.
Additionally, understanding what is or isn’t working is also essential within the context of your overall Instagram marketing strategy. You want to make sure you know the types of content to continue creating and which may need tweaking.
Though total followers may be seen as a vanity metric to some, it ultimately represents the potential reach of your content. This impacts the performance of other IG metrics like engagement, so continued focus on organically growing your audience is still as important as ever.
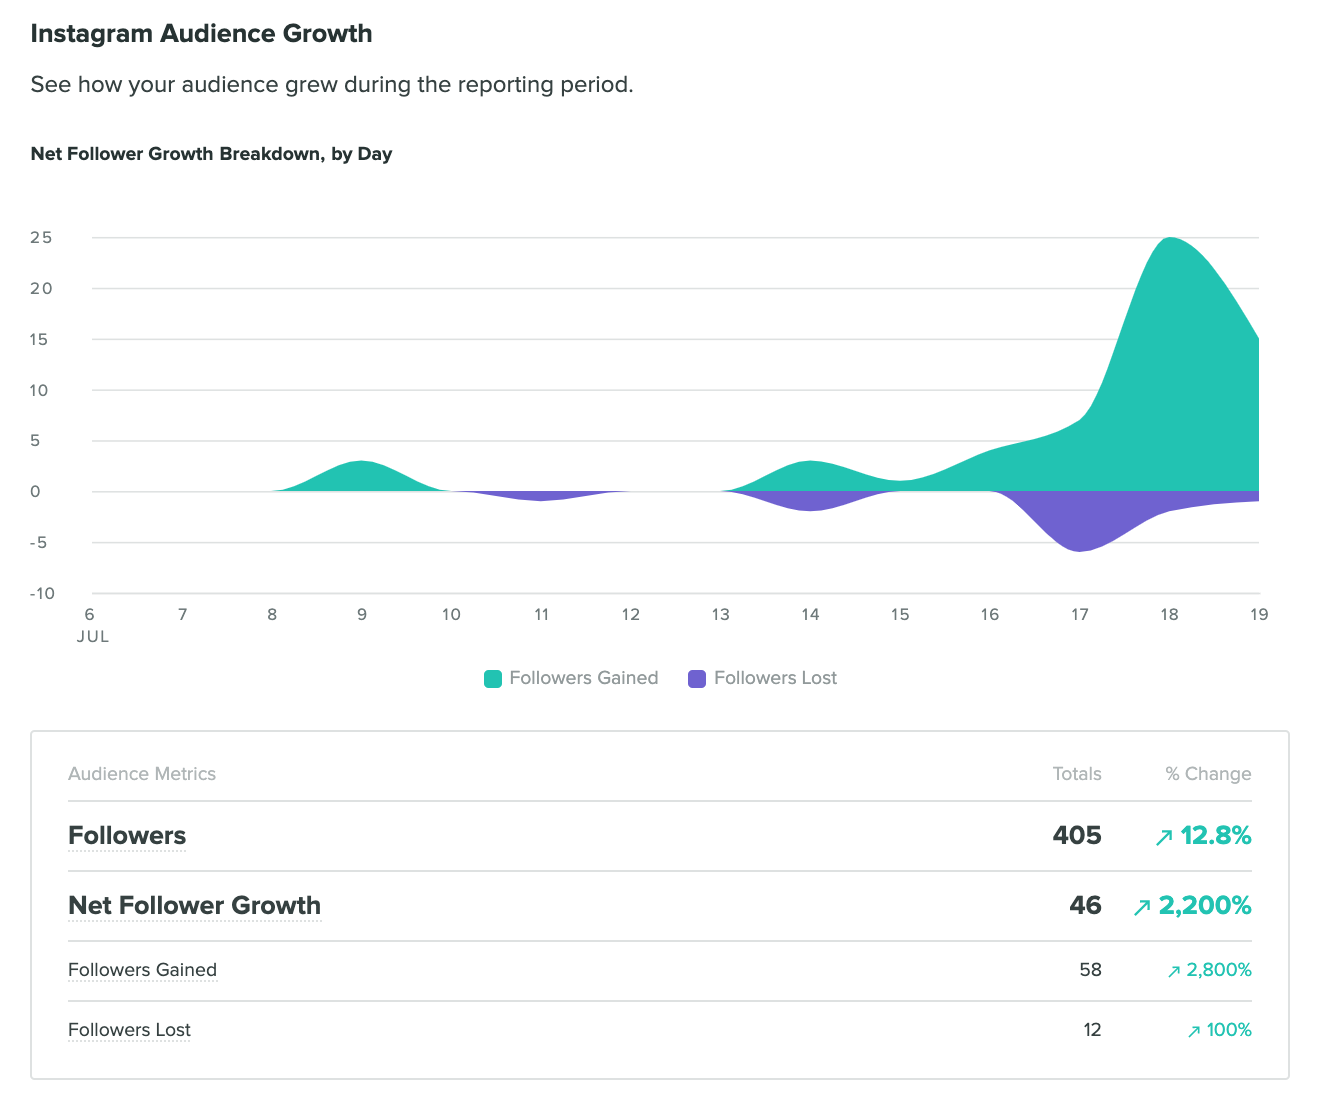
How to measure follower growth with Sprout
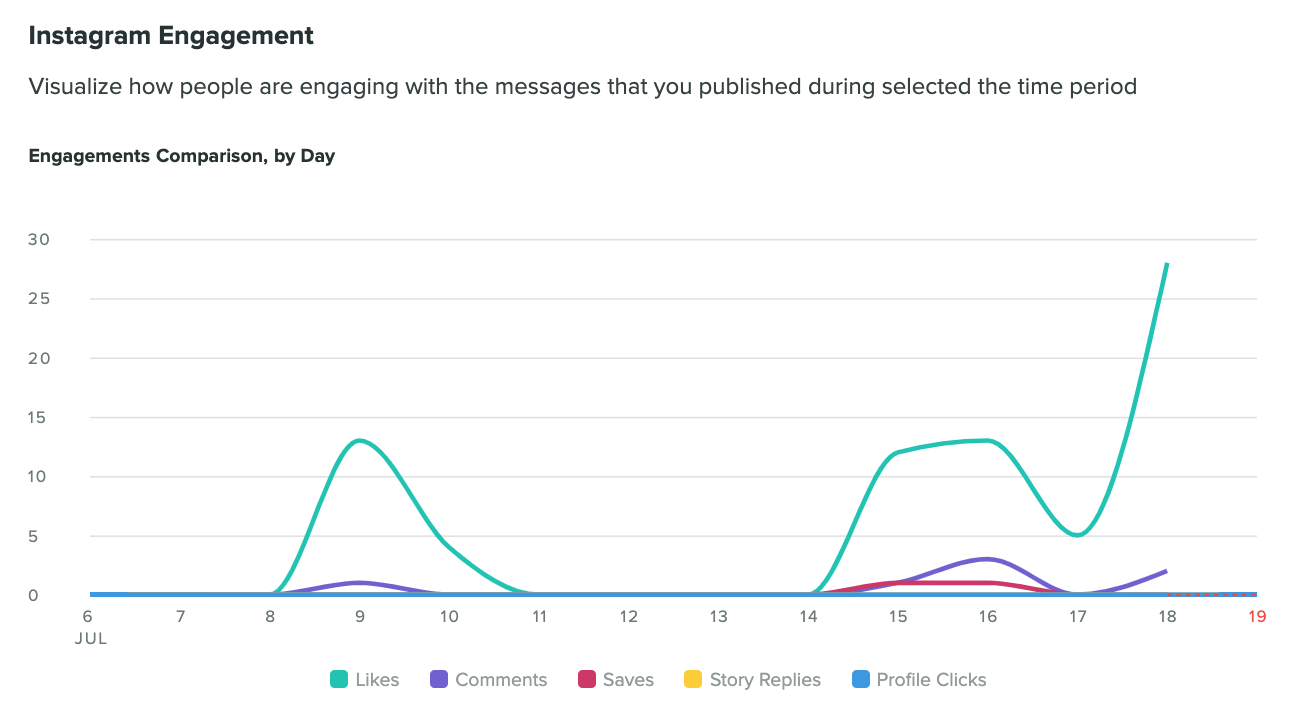
Sprout enables you to see all kinds of information about your follower growth, from a comprehensive growth chart to percentage growth. Select the time period during which you want to measure your follower growth and then see the differences in followers gained and lost for that reporting period with the Instagram Business Profiles overview. You can then dive into the Post Performance Report, using the same time period, to specifically see what content resonated and what didn’t perform so well.
5. Comments received
What this metric tells you: How engaging your content is.
There’s a major difference between likes and comments when it comes to evaluating Instagram performance metrics.
Likes are fairly easy to dish out and oftentimes you can’t be 100% certain a post was truly seen by your followers. With comments, it’s crystal clear. Whether positive or negative, comments left on your posts are an indication that your content had some kind of impact, or at least enough for the individual to take the extra step to leave feedback.
This type of engagement, especially when positive, is a strong factor in community building and establishing a loyal fanbase. Anyone can double tap with ease but those who go out of their way to comment are the ones to keep an eye on.
Managing comments in Sprout
Depending on the size of your Instagram account, it may be manageable to simply review your posts one by one to view and record comment counts. But with Sprout, the work is done for you.
Using the Instagram Business Profiles Report mentioned earlier, comment totals over a specified time period appear alongside other engagement metrics. You can then cross-reference comment counts with the actual feedback being received to determine sentiment and whether or not your content is working as desired.
6. Most engaged hashtags
What this metric tells you: Hashtag performance.
While the fickle Instagram algorithm may sometimes wreak havoc on your content strategy, hashtags have proven to be one of the most reliable ways to keep your momentum going.
By using hashtags that are relevant to your industry or what your audience is searching for you can help keep reach and engagement in check.
Instagram users can include up to 30 hashtags on each post, but be sure to use that quota wisely through research and learning from performance over time. You may be surprised by how often less is more when it comes to hashtags.
Measuring hashtag performance in Sprout
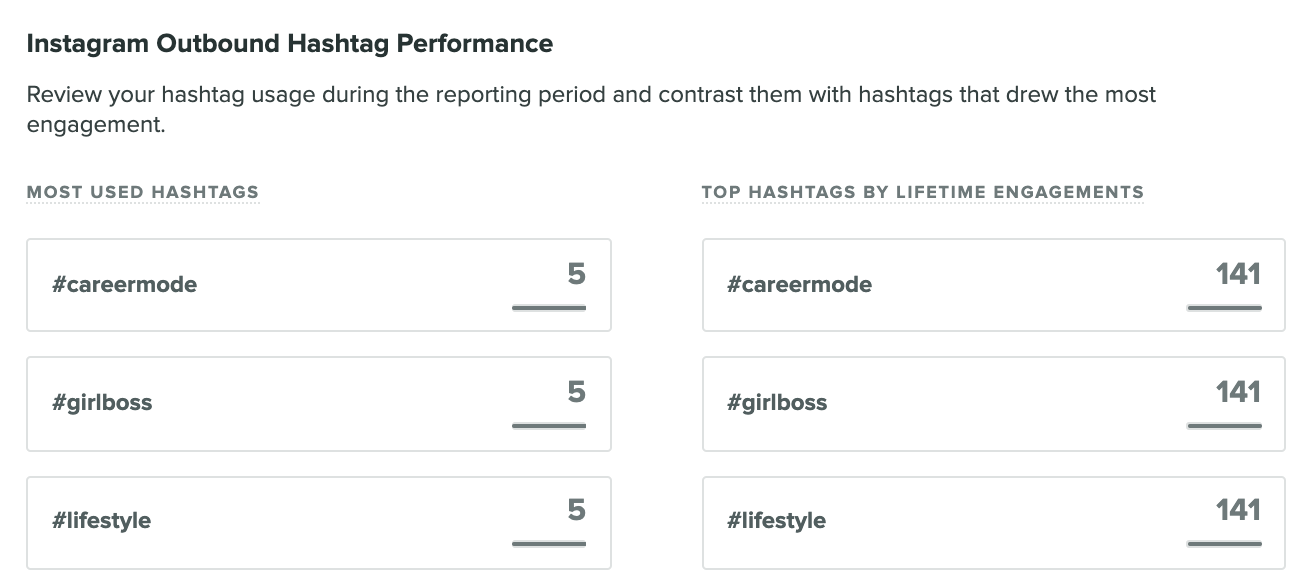
To maximize this particular IG metric, you’ll want to spend time reviewing your Instagram Outbound Hashtag Performance within Sprout.
As displayed in the following chart, you get a full breakdown of your hashtags organized by both usage and engagement in the Instagram Business Profiles Report. You can use this data to inform future hashtag decisions, especially when it comes to engagement performance relative to other efforts.
7. Referral traffic
What this metric tells you: Instagram’s impact on your website traffic.
Referral traffic describes the people who come to your domain from other sites, without finding you on a search engine. When someone visits a link from social media or a website and they end up on your, Google analytics recognizes the visitor as a referral. You can also use UTM codes to track precisely where these visits come from.
A common tactic for social media posts involves linking out to a website’s specific landing page, product page or even just the home page depending on the type of action you’d like your followers to take upon seeing your post.
But on Instagram, this can be a bit more challenging because the only place to display a clickable link is inside your bio. You also have the option to include URLs within your captions, but either way, tracking referral traffic from Instagram can be tricky.
How to track referral traffic
As mentioned, because Instagram doesn’t allow clickable links within your posts, one great way to track referral traffic from a particular campaign is with UTM parameters. UTM parameters are tags you can tack onto a URL that lets Google Analytics (or other tools) know exactly where the user referred from.
If you’re implementing any landing pages specifically for an IG campaign, you’ll want to read up on how to set up your own UTM parameters to ensure they’ll work correctly.
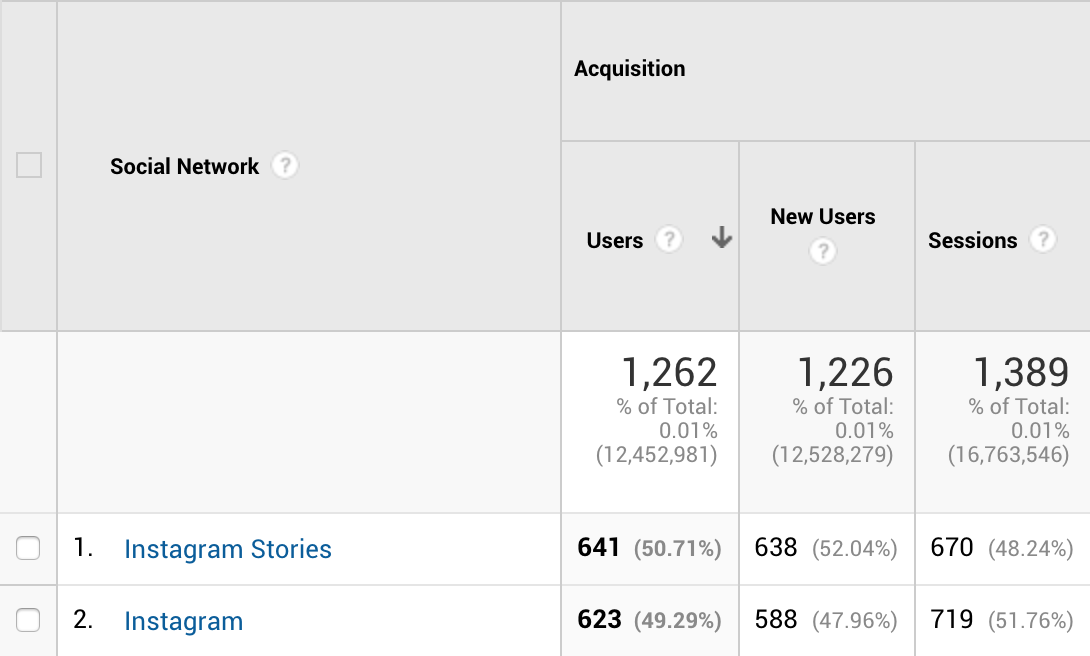
You can also check your social network referral traffic in Google Analytics to see how much traffic Instagram has sent your way, including distinguishing between Instagram (your bio link clicks) and Instagram Stories (your story swipe ups).
8. Instagram Stories metrics
What this metric tells you: How popular and engaging your Instagram Stories are.
Arguably one of the most essential components to current Instagram marketing strategies involves the use of Stories.
These are useful in a number of ways, most notably because they provide another dimension of content for your audience. The disappearing nature of the photos and videos gives you even more freedom and flexibility than your feed does.
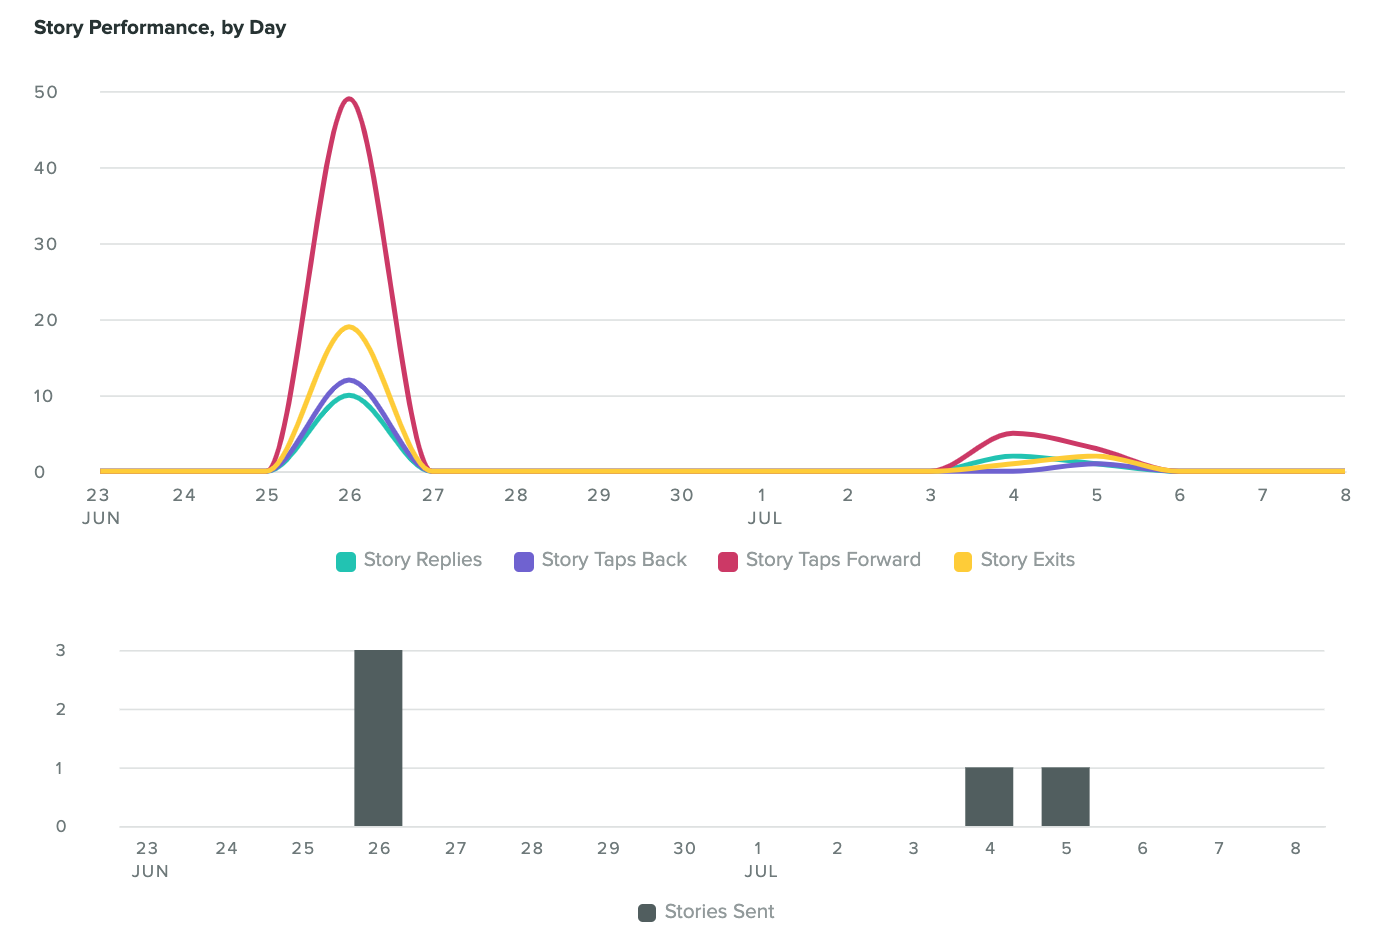
When it comes to Instagram Stories, there are a few good metrics to keep tabs on such as Story Replies, Story Taps Back and Forward, Story Exits and Impressions.
Using Sprout to view Instagram Story stats
If any of the above metrics interest you, locate the Instagram Stories Performance section of the Instagram Business Profiles Report in Sprout to view data for each connected profile.

Start tracking your Instagram metrics today
With all the essential IG metrics in hand, you’re ready to start reporting on progress. Be sure to use Sprout’s full offering of Instagram Analytics to go even deeper into your performance.
If you’re not already using Sprout, take advantage of a free 30-day trial or request a personalized demo to get started today.
The post 8 essential Instagram metrics to measure performance appeared first on Sprout Social.
from Sprout Social https://ift.tt/Yk0vaIN
via IFTTT
No comments:
Post a Comment