When you think about social media customer service, there are probably two encounters that come to mind: the best experience a brand ever provided…and the worst.
For example, maybe you’re completely loyal to the airline whose customer service rep magically found you the perfect flight. Even in the face of price increases and flight cancellations, you’ll never book with another airline again.
On the other hand, you might still be furious at the furniture company that delivered the wrong items to your home and refused to refund you. Even after five years, nothing can persuade you to end your boycott of the brand.
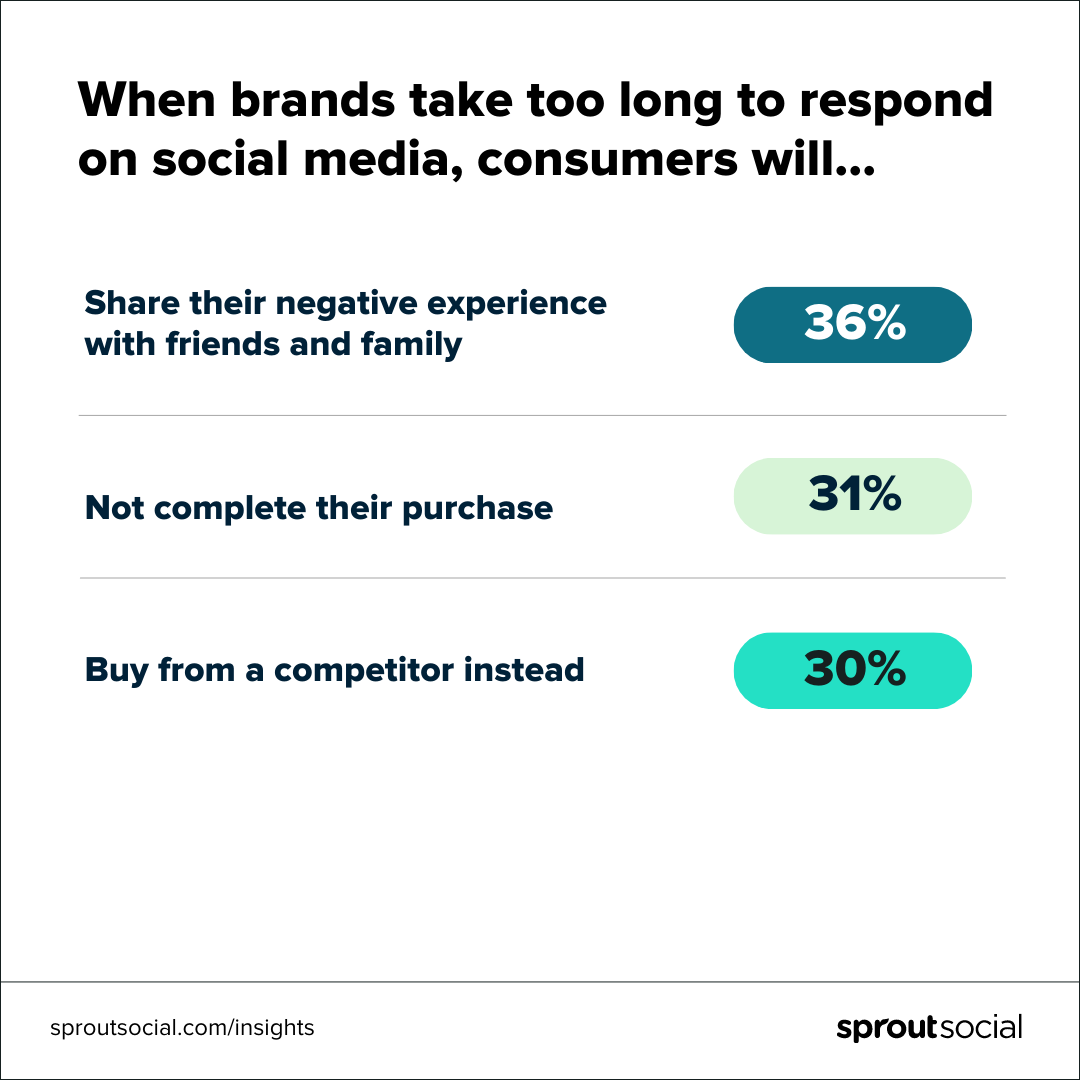
Many of us know firsthand that poor social customer service has consequences, and the data agrees. According to The Sprout Social Index™, when brands take too long to respond, 36% of consumers share their negative experience with friends and family, 31% won’t complete their purchase and 30% buy from a competitor instead.
Only the brands that go above and beyond for their customers receive enviable brand loyalty. In this article, we’re breaking down the essential social media customer service metrics you need to track to ensure you provide exceptional service and care on social. As customer service inquiries continue to increase on the channel, up-leveling your efforts will help you future-proof your business and stand out from your competition.
What are social media customer service metrics?
Social media customer service metrics are data points that help you tell the story of how well your customer care efforts are satisfying your customers. These metrics uncover what your social customer care team is doing well, where there are opportunities to improve and what tools are needed to fill those gaps. Social customer service metrics can be grouped into three categories: speed and efficiency, volume and team productivity, and sentiment.

Social customer support data also reveals how your support strategy on social fits into the omnichannel customer experience your brand provides. Using data empowers you to answer questions like:
- Where are our customers most likely to make service inquiries?
- How satisfied are our customers with the support we provide on social? How does it compare to other channels?
- What are our customers’ most common questions?
- Where in the funnel are our customers most likely to get stuck?
How to use customer service metrics to level-up your org-wide performance
Tapping into customer service metrics will help evolve your approach to customer care. With these findings, you will be on track to cultivate an emotional connection with your audience, build brand loyalty and foster customer retention and advocacy.
But the use of these metrics goes beyond improving the customer experience. Social media customer service metrics have the power to transform the way you do business—from refining product development to building your company-wide strategy. For example, the team at Grammarly uses incoming customer support messages to surface valuable user stories for their product and user experience teams, as well as company leadership.
And they’re not alone. In a Gartner online survey of 283 customer service and support leaders from August–October 2022, 84% of customer service and service support leaders cited customer data and analytics as “very or extremely important” for achieving their organizational goals in 2023.
Customer insights gleaned from service interactions on social are your “secret sauce” for building cross-functional collaboration at your company. Let’s get into the 10 specific metrics you need to monitor, and how you can track them with Sprout Social.
Speed and efficiency customer service metrics
How quickly your brand responds on social media contributes to your reputation for providing good customer service. According to Index data, while more than three-quarters of consumers expect a response in the first 24 hours of reaching out to a brand on social, 57% actually expect a response within the first hour.
Measuring your team’s response rate efficiency is imperative. Look to the following metrics to help benchmark and improve your performance.
1. Average first reply time
Average first reply time refers to the time it takes for your team to send out the first reply to an inbound customer message within business hours.
2. Average reply wait time
Measuring the time to your first response is just the beginning. Average reply time reveals how long customers wait in between responses until their issues are resolved, which is equally important.
For example, if it took five minutes for you to reply to their first message, and 10 minutes to reply to their second, the average reply wait time would be seven minutes.
How to track these in Sprout Social
In Sprout Social, the Smart Inbox unifies all your incoming messages into a single stream, enabling you to monitor incoming messages, foster conversations and respond to your audience quickly. The Inbox also creates multiple reports that visualize and contextualize your team’s customer service performance.

The Inbox Team Report enables you to evaluate your brand’s reply times at a team level and distill the metrics down by team member. The report also demonstrates median first reply times, slowest reply times, unique messages replied to and total replies listed by team members.
Use these insights to evaluate agent response performance more accurately, identify bottlenecks within your team’s workflows and closely monitor each agent’s activity for quality assurance or training purposes.

By using features like this in Sprout, MeUndies reduced their average response time to less than 20 minutes.
Volume and team productivity customer service metrics
High-quality customer service isn’t just about response times. You must also demonstrate that you’re resolving all customers’ problems, questions and inquiries that require comprehensive support solutions. To do this, compare your productivity data to your overall volume and social media customer service stats in your industry.
3. Total received messages
The number of total received messages indicates how many total customer messages landed in your inbox.
4. Total replies or response volume
This figure represents the total number of responses your team sends to customers.
5. Reply or response rate
Response rate is the rate that brands respond to messages or comments that they receive on a daily basis. Not every single comment or message will need a response, and the amount you need to respond depends on the needs of your customers.
Social media response rates vary by industry, with an average overall response rate of 34%. The consumer products, health, wellness and fitness, retail and food and beverage industries are leading response rates by responding to over half of all incoming customer messages.

6. Resolution rate
Resolution rate—the percentage of customer inquiries that are fully resolved—reveals how equipped your entire company is to address customer inquiries. This data illustrates how well your internal teams collaborate to find solutions for customers in a timely manner. It’s calculated by dividing the number of total actioned messages by the total number of messages.
How to track these in Sprout Social
The Inbox Activity Report provides a holistic view of your team’s social care efforts by presenting trends of incoming message volume and identifying the rate and speed of actions taken on messages by your teams. This report answers how much your team is accomplishing in the Smart Inbox.

You can also use the Task Performance Report to measure your team’s productivity and efficiency based on task management. The report compares the number of assigned tasks with the total completed tasks.

Sentiment customer service metrics
With so much valuable performance data, it might be tempting to zero-in on ways you can optimize your social customer care strategy. But don’t forget about the big picture. The insights you gain from your customer interactions are integral to your entire company’s strategy. Maximize the impact of your direct access to the customer by sharing sentiment analysis data companywide.
7. Most used quick replies
If you use a chatbot to optimize customer interactions on social, most used quick replies refer to the most commonly selected options. Use this data point to identify customer support trends, and optimize your customer service process to address these common requests quickly.
8. Most received topics and subtopics
The keywords or themes that pop up in your inbox often are your most received topics and subtopics. Tracking these topics and subtopics is challenging without the use of a tagging system or machine learning capabilities—however, tuning into them is essential for learning about your audience.
9. Positive and negative sentiment
Sentiment trends tell you a lot about what your customers think about your brand, products and services. Overall, sentiment can be described as generally positive or negative. Although that doesn’t encompass the full context of a customer’s experience, it does help you track and maintain a healthy ratio of positive sentiment, and be on the lookout for changes over time.
10. Voice of the customer data
Social media could be described as the world’s largest focus group. It unlocks an unprecedented amount of voice of the customer data, which helps you get to know your customers’ behavior, pain points, preferences and needs on a deeper level. This customer service metric is less quantifiable, but nonetheless rich in value.
How to track these in Sprout Social
When you receive incoming messages in Sprout’s Smart Inbox, you are able to add tags that indicate the content of the messages. For example, you can tag for audience type or service issue. Tagging your messages will enable you to visualize trends and report findings.

You can also use Sprout’s artificial intelligence-powered listening tools to uncover sentiment trends from the Inbox. Listening tools make it easy to track changes in sentiment, which empower you to share reports in a timely manner—and act on negative sentiment before it’s too late.

Provide your customers with an unforgettable social customer service experience
Whether you’re part of a social media team handling social support, part of a dedicated support team or somewhere in between, ground yourself in your goals for customer service. Then, as you measure performance and social media customer care metrics, you can adjust and better cater to your customers.
Try Sprout Social free for 30 days to start gathering these insights and get to know your customers on a deeper level.
The post The social media customer service metrics that experts measure appeared first on Sprout Social.
from Sprout Social https://ift.tt/TSzGq4L
via IFTTT
No comments:
Post a Comment